
PHP GRAFİK UYGULAMA
Aşağıdaki örneklerde PHPGraphLib'in neler yapabileceğini görün! Aşağıda kullanılan işlevler hakkında daha fazla ayrıntı için belgelerin İşlev Başvurusu bölümüne bakın.
İnternette
Kod:
|
1
2
3
4
5
6
7
8
9
10
|
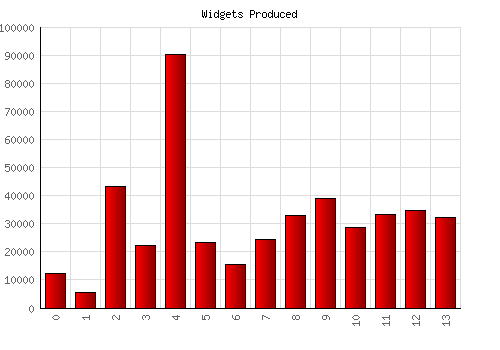
<?phpinclude('phpgraphlib.php');$graph = new PHPGraphLib(500,350);$data = array(12124, 5535, 43373, 22223, 90432, 23332, 15544, 24523, 32778, 38878, 28787, 33243, 34832, 32302);$graph->addData($data);$graph->setTitle('Widgets Produced');$graph->setGradient('red', 'maroon');$graph->createGraph();?> |
Sonuç Grafiği:
Örnek 2
Kod:
|
1
2
3
4
5
6
7
8
9
10
11
|
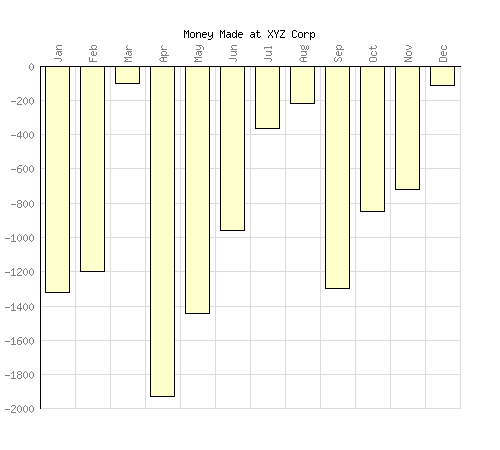
<?phpinclude('phpgraphlib.php');$graph = new PHPGraphLib(500,450);$data = array("Jan"=>-1324, "Feb"=>-1200, "Mar"=>-100, "Apr"=>-1925, "May"=>-1444, "Jun"=>-957, "Jul"=>-364, "Aug"=>-221, "Sep"=>-1300, "Oct"=>-848, "Nov"=>-719, "Dec"=>-114);$graph->addData($data);$graph->setBarColor('255,255,204');$graph->setTitle('Money Made at XYZ Corp');$graph->setTextColor('gray');$graph->createGraph();?> |
Sonuç Grafiği:
Örnek 3
Kod:
|
1
2
3
4
5
6
7
8
9
10
11
12
13
14
15
16
17
18
19
20
21
22
|
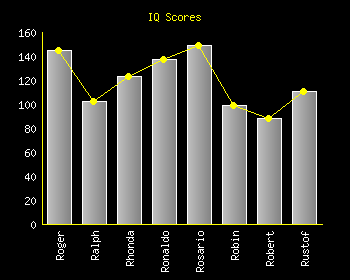
<?phpinclude('phpgraphlib.php');$graph = new PHPGraphLib(350,280);$data = array("Roger"=>145, "Ralph"=>102, "Rhonda"=>123, "Ronaldo"=>137, "Rosario"=>149, "Robin"=>99, "Robert"=>88, "Rustof"=>111);$graph->setBackgroundColor("black");$graph->addData($data);$graph->setBarColor('255,255,204');$graph->setTitle('IQ Scores');$graph->setTitleColor('yellow');$graph->setupYAxis(12, 'yellow');$graph->setupXAxis(20, 'yellow');$graph->setGrid(false);$graph->setGradient('silver', 'gray');$graph->setBarOutlineColor('white');$graph->setTextColor('white');$graph->setDataPoints(true);$graph->setDataPointColor('yellow');$graph->setLine(true);$graph->setLineColor('yellow');$graph->createGraph();?> |
Sonuç Grafiği:
Örnek 4
Kod:
|
1
2
3
4
5
6
7
8
9
10
11
12
13
14
15
16
17
18
19
20
21
|
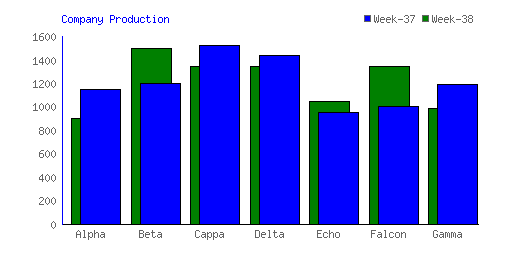
<?phpinclude('phpgraphlib.php'); $graph=new PHPGraphLib(520,280);$data=array("Alpha" => 1145, "Beta" => 1202, "Cappa" => 1523, "Delta" => 1437, "Echo" => 949, "Falcon" => 999, "Gamma" => 1188);$data2=array("Alpha" => 898, "Beta" => 1498, "Cappa" => 1343, "Delta" => 1345, "Echo" => 1045, "Falcon" => 1343, "Gamma" => 987);$graph->addData($data, $data2);$graph->setBarColor('blue', 'green');$graph->setTitle('Company Production');$graph->setupYAxis(12, 'blue');$graph->setupXAxis(20);$graph->setGrid(false);$graph->setLegend(true);$graph->setTitleLocation('left');$graph->setTitleColor('blue');$graph->setLegendOutlineColor('white');$graph->setLegendTitle('Week-37', 'Week-38');$graph->setXValuesHorizontal(true);$graph->createGraph();?> |
Sonuç Grafiği:
Örnek 5
Kod:
|
1
2
3
4
5
6
7
8
9
10
11
12
13
14
|
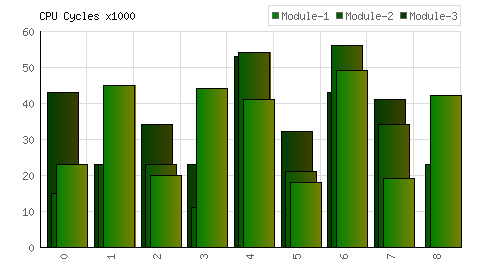
<?phpinclude('phpgraphlib.php');$graph=new PHPGraphLib(500,280);$data = array(23, 45, 20, 44, 41, 18, 49, 19, 42);$data2 = array(15, 23, 23, 11, 54, 21, 56, 34, 23);$data3 = array(43, 23, 34, 23, 53, 32, 43, 41);$graph->addData($data, $data2, $data3);$graph->setTitle('CPU Cycles x1000');$graph->setTitleLocation('left');$graph->setLegend(true);$graph->setLegendTitle('Module-1', 'Module-2', 'Module-3');$graph->setGradient('green', 'olive');$graph->createGraph();?> |
Sonuç Grafiği:
Örnek 6
Kod:
|
1
2
3
4
5
6
7
8
9
10
11
12
13
14
15
16
17
18
19
|
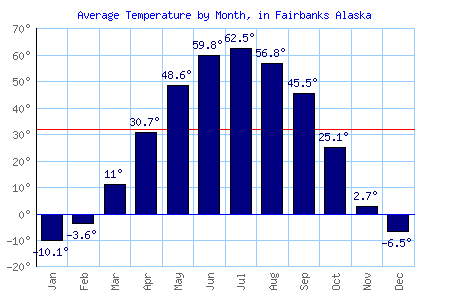
<?phpinclude('phpgraphlib.php');$graph = new PHPGraphLib(450,300);$data = array("Jan" => -10.1, "Feb" => -3.6, "Mar" => 11.0, "Apr" => 30.7, "May" => 48.6, "Jun" => 59.8, "Jul" => 62.5, "Aug" => 56.8, "Sep" => 45.5, "Oct" => 25.1, "Nov" => 2.7, "Dec" => -6.5);$graph->addData($data);$graph->setBarColor('navy');$graph->setupXAxis(20, 'blue');$graph->setTitle('Average Temperature by Month, in Fairbanks Alaska');$graph->setTitleColor('blue');$graph->setGridColor('153,204,255');$graph->setDataValues(true);$graph->setDataValueColor('navy');$graph->setDataFormat('degrees');$graph->setGoalLine('32');$graph->setGoalLineColor('red');$graph->createGraph();?> |
Sonuç Grafiği:
Örnek 7
Kod:
|
1
2
3
4
5
6
7
8
9
10
11
12
13
14
15
16
17
18
19
|
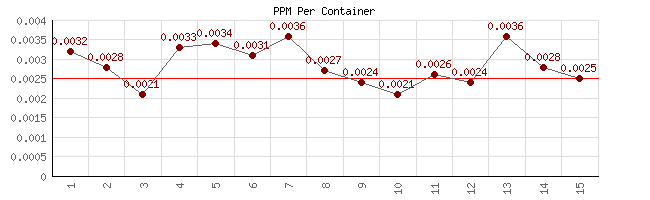
<?phpinclude('phpgraphlib.php');$graph = new PHPGraphLib(650,200);$data = array("1" => .0032, "2" => .0028, "3" => .0021, "4" => .0033, "5" => .0034, "6" => .0031, "7" => .0036, "8" => .0027, "9" => .0024, "10" => .0021, "11" => .0026, "12" => .0024, "13" => .0036, "14" => .0028, "15" => .0025);$graph->addData($data);$graph->setTitle('PPM Per Container');$graph->setBars(false);$graph->setLine(true);$graph->setDataPoints(true);$graph->setDataPointColor('maroon');$graph->setDataValues(true);$graph->setDataValueColor('maroon');$graph->setGoalLine(.0025);$graph->setGoalLineColor('red');$graph->createGraph();?> |
Sonuç Grafiği:
Örnek 8
Kod:
|
1
2
3
4
5
6
7
8
9
10
11
|
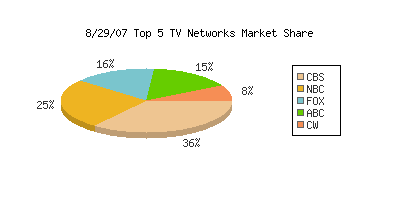
<?phpinclude('phpgraphlib.php');include('phpgraphlib_pie.php');$graph = new PHPGraphLibPie(400, 200);$data = array("CBS" => 6.3, "NBC" => 4.5,"FOX" => 2.8, "ABC" => 2.7, "CW" => 1.4);$graph->addData($data);$graph->setTitle('8/29/07 Top 5 TV Networks Market Share');$graph->setLabelTextColor('50,50,50');$graph->setLegendTextColor('50,50,50');$graph->createGraph();?> |
Sonuç Grafiği:
Örnek 9
Kod:
|
1
2
3
4
5
6
7
8
9
10
11
12
13
14
15
16
|
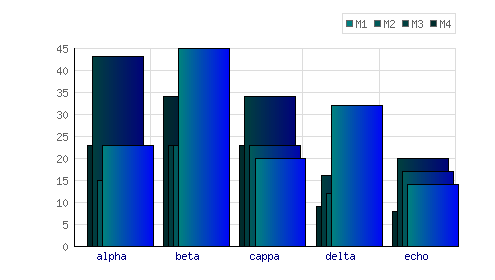
<?phpinclude('phpgraphlib.php');$graph = new PHPGraphLib(495,280);$data = array('alpha'=>23, 'beta'=>45, 'cappa'=>20, 'delta'=>32, 'echo'=>14);$data2 = array('alpha'=>15, 'beta'=>23, 'cappa'=>23,'delta'=>12, 'echo'=>17);$data3 = array('alpha'=>43, 'beta'=>23, 'cappa'=>34, 'delta'=>16, 'echo'=>20);$data4 = array('alpha'=>23, 'beta'=>34, 'cappa'=>23, 'delta'=>9, 'echo'=>8);$graph->addData($data, $data2, $data3, $data4);$graph->setupYAxis("15");$graph->setGradient('teal', '#0000FF');$graph->setXValuesHorizontal(true);$graph->setXAxisTextColor ('navy');$graph->setLegend(true);$graph->setLegendTitle('M1', 'M2', 'M3', 'M4');$graph->createGraph();?> |
Sonuç Grafiği:
Örnek 10
Kod:
|
1
2
3
4
5
6
7
8
9
10
11
12
13
14
15
16
17
|
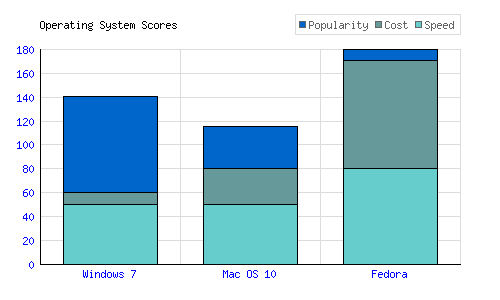
<?phpinclude('phpgraphlib.php');include('phpgraphlib_stacked.php');$graph = new PHPGraphLibStacked(500,300);$popularity = array('Windows 7'=>80, 'Mac OS 10'=>35, 'Fedora'=>9);$cost = array('Windows 7'=>10, 'Mac OS 10'=>30, 'Fedora'=>90);$speed = array('Windows 7'=>50,'Mac OS 10'=>50,'Fedora'=>80);$graph->addData($popularity, $cost, $speed);$graph->setTitle('Operating System Scores');$graph->setTitleLocation('left');$graph->setXValuesHorizontal(TRUE);$graph->setTextColor('blue');$graph->setBarColor('#0066CC', '#669999', '#66CCCC');$graph->setLegend(TRUE);$graph->setLegendTitle('Popularity', 'Cost', 'Speed');$graph->createGraph();?> |
Sonuç Grafiği:


0 Yorum Yapıldı